Cell movement is a physical process whereby protrusion and adhesion formation occur at the front, while contractile forces facilitate cell detachment and retraction at the rear. Each of these processes requires force generation by the actin cytoskeleton. A protrusive force at the front is produced by the polymerization of actin filaments beneath the plasma membrane. Adhesive forces anchor moving cells to the substrate. These forces arise both from receptor ligand interaction on the extracellular side, and molecular linkages between adhesions and the contractile cytoskeleton, intracellularly. Cells generate contractile forces through the interaction between actin and myosin II, which act inward perpendicular to the cell margin. Contractile forces reinforce newly formed adhesions at the front, while promoting adhesion disassembly at the rear.
One of the goals of our research is to understand how the generation of mechanical force organizes cytoskeletal function to produce cell movement.
Traction force assays allow detection of the forces that drive cell movement
l
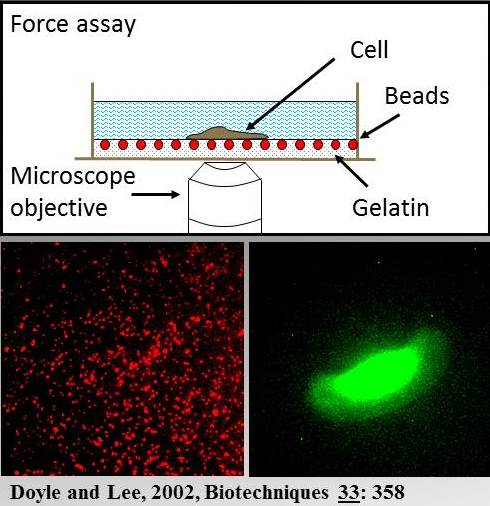
Diagram of a traction force assay
We use traction force assays to detect the pattern of forces that moving cells exert on their substrata. These consist of an elastic sheet, in which microscopic (0.5 um in diameter) fluorescent marker beads are embedded. Using dual fluorescence microscopy we collect a seqence of paired images showing marker bead displacements (red) and the change in cell position (green) during movement. This information is used to calculate the distribution of traction stresses beneath the cell and is represented as traction vector maps. These reveal the size, direction and distribution of traction forces that are used to drive cell movement. In the example shown here (see movie) a fish epithelial keratocyte is crawling on a thin (~ 30 um in thickness) film of Knox Jello gelatin (unflavored).
l
What have traction force assays revealed about the organization of cytoskeletal function in keratocytes?
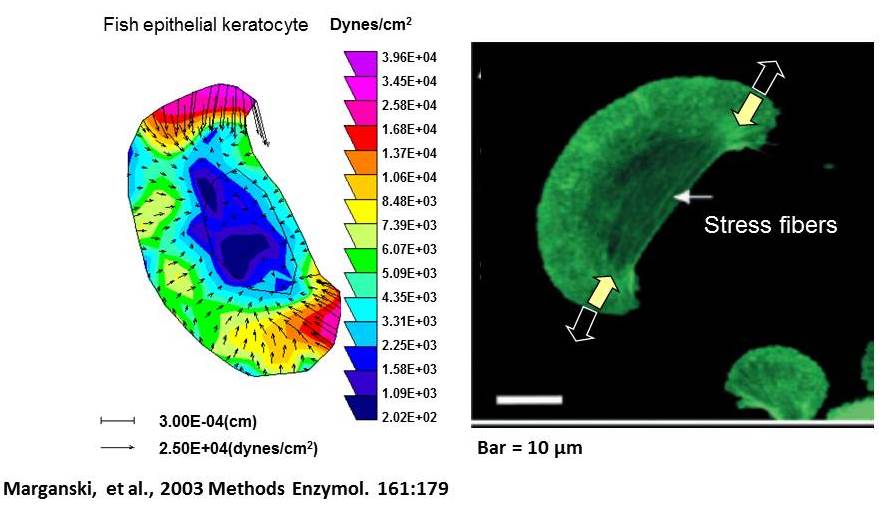
The largest traction forces are at the lateral rear edges of the cell and are oriented inward, perpendicular to the cell margin. These produce “pinching” tractions on the substratum (yellow arrows on fluorescence image) which are opposed by adhesive forces (open arrows). This produces tension in the cytoskeleton as shown by the existence of stress fibers. The traction vector map suggests that high contractility at the cell rear promotes retraction and inhibits protrusion, while low contractility at the front favors protrusion. This arrangement of traction forces allows retraction to occur at the rear almost simultaneously with protrusion at the front that leads to a rapid “gliding” mode of movement.
Stretch-induced calcium transients regulate the timing and location of increases in traction force.
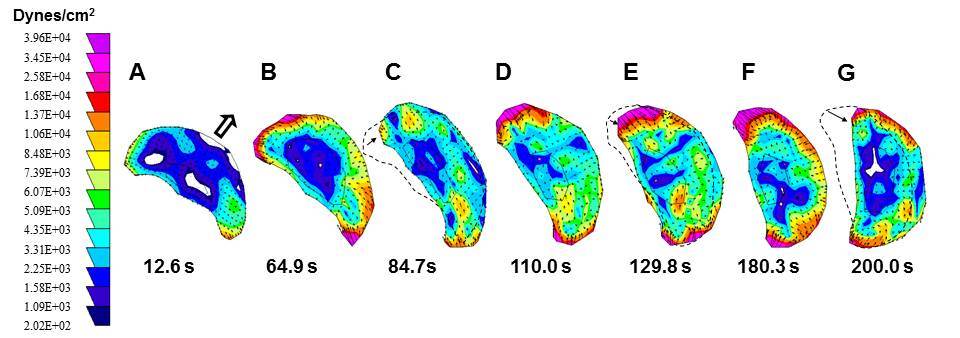
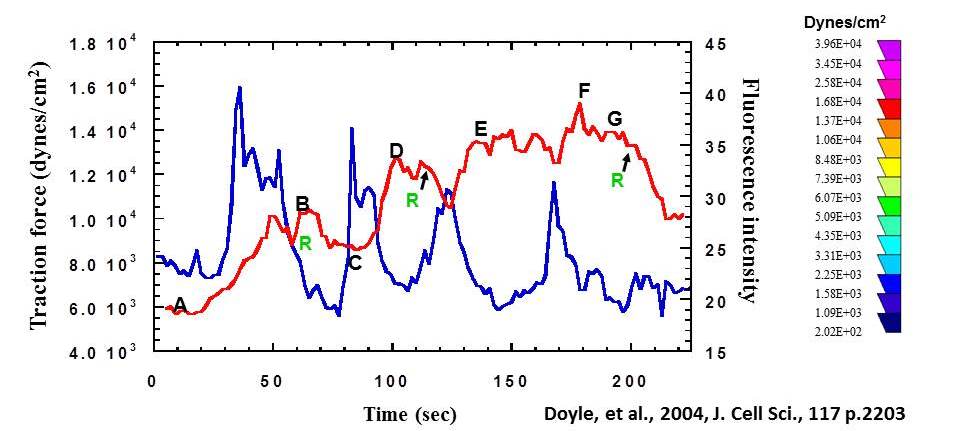
Plots of calcium indicator fluorescence (blue) and 90th percentile traction stress (red) corresponding to the traction vector maps (a-g) above. The graph shows that traction force increases in a stepwise manner after each transient (fluorescence peaks) and drops in response to retraction (R). Thus stretch-activated calcium signaling regulates the timing and location of increases in traction force.
l
What have traction force assays revealed about the organization of cytoskeletal function in keratocytes?
The largest traction forces are at the lateral rear edges of the cell and are oriented inward, perpendicular to the cell margin. These produce “pinching” tractions on the substratum (yellow arrows on fluorescence image) which are opposed by adhesive forces (open arrows). This produces tension in the cytoskeleton as shown by the existence of stress fibers. The traction vector map suggests that high contractility at the cell rear promotes retraction and inhibits protrusion, while low contractility at the front favors protrusion. This arrangement of traction forces allows retraction to occur at the rear almost simultaneously with protrusion at the front that leads to a rapid “gliding” mode of movement.
Stretch-induced calcium transients regulate the timing and location of increases in traction force.
Plots of calcium indicator fluorescence (blue) and 90th percentile traction stress (red) corresponding to the traction vector maps (a-g) above. The graph shows that traction force increases in a stepwise manner after each transient (fluorescence peaks) and drops in response to retraction (R). Thus stretch-activated calcium signaling regulates the timing and location of increases in traction force.